Environmental Initiatives
We have set targets for greenhouse gas (CO₂) emissions, energy consumption, water consumption, etc., and seek to meet these targets through improvement of building management, capital investment, energy efficiency training for tenants, property managers, etc. and other initiatives.
Set Targets
■ Greenhouse Gas (CO₂) Emissions
- 42% reduction in greenhouse gas (CO₂) emissions (Scope 1 and 2) intensity by FY2030 (vs. FY2020)
- Achieving net zero greenhouse gas (CO₂) emissions (Scope 1, 2, and 3 total emissions) by FY2050
■ Energy Consumption
- To reduce intensity for the entire portfolio by 1% every year
■ Water Consumption
- To reduce intensity for the entire portfolio to not exceed that of the previous fiscal year every year
■ Waste Emissions
- To improve recycling rate in the entire portfolio each fiscal year over the previous year
Performance Data
■ Greenhouse Gas (CO₂) Emissions
| Fiscal Year | 2020 (Base Year) |
2021 | 2022 |
|---|---|---|---|
| Absolute Emissions (Scope1,2) (t-CO₂) |
9,292 | 7,579 | 7,736 |
| Emissions Intensity(Scope1,2) (Kg-CO₂/㎡) |
80.6 | 58.3 | 57.4 |
| Emissions Intensity(Scope1,2) % Change (vs. 2020) |
- | -27.7% | -28.8% |
| (Note 1) | Performance data is based on the amount consumed in the common areas of properties managed by NUD. In addition, for co-ownership properties, the figures are adjusted according to the ownership ratio. Intensity is calculated by dividing the annual emission volume by intensity denominator (annual average floor area of common area [㎡] after ownership interest conversion) |
|---|---|
■ Energy Consumption
| Fiscal Year | 2020 (Base Year) |
2021 | 2022 |
|---|---|---|---|
| Absolute Consumption (based on Scope1,2,3) (MWh) |
69,399 | 75,074 | 75,768 |
| Consumption Intensity (based on Scope1,2,3) (MWh/㎡) |
0.163 | 0.169 | 0.165 |
| Consumption Intensity (based on Scope1,2,3) Year on Year |
- | 103.8% | 97.5% |
| Renewable Energy Usage (MWh) |
0 | 4,203 | 8,830 |
| (Note 1) | The figures are adjusted according to the ownership ratio for co-ownership properties. Intensity is calculated by dividing the annual consumption volume by intensity denominator (annual average total floor area [㎡] after ownership interest conversion) |
|---|---|
| (Note 2) | "Renewable Energy Usage" indicates the amount of electricity consumption derived from renewable energy sources (including the purchase of renewable energy certificates), which is deducted from "Absolute Consumption". |
■ Water Consumption
| Fiscal Year | 2021 | 2022 | Year on Year |
|---|---|---|---|
| Absolute Consumption (㎥) | 134,147 | 132,022 | 98.4% |
| Consumption Intensity (㎥/㎡) | 0.471 | 0.440 | 93.4% |
| (Note 1) | Performance data is based on the amount consumed in office buildings managed by NUD. In addition, for co-ownership properties, the figures are adjusted according to the ownership ratio. Intensity is calculated by dividing the annual consumption volume by intensity denominator (annual average total floor area [㎡] after ownership interest conversion) |
|---|---|
■ Waste Emissions
| Fiscal Year | 2021 | 2022 | Year on Year |
|---|---|---|---|
| Absolute Emissions(t) | 986 | 992 | 100.6% |
| Recycling Rate | 53.0% | 48.7% | 91.9% |
| (Note 1) | Performance data is based on the amount consumed in the common areas and tenant areas of office buildings managed by NUD. In addition, for co-ownership properties, the figures are adjusted according to the ownership ratio. |
|---|
Examples of Initiatives
■ Switching Lighting to LED
Switching lighting in common areas, rental units, etc. of portfolio properties to LED in view of environmental consideration and cost reduction.
As of October 31, 2023
introduced at
58 properties out of 59
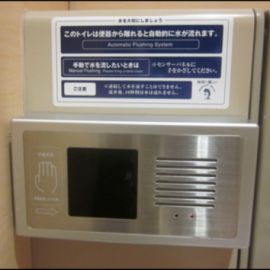
■ Introduction of Water-Efficient Equipment
Introducing water-efficient equipment at portfolio properties in view of environmental consideration and cost reduction.
As of October 31, 2023
introduced at
53 properties out of 59
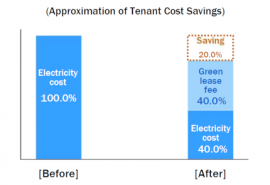
■ Introduction of Green Leasing
“Green lease” is an arrangement providing for the promotion of energy efficiency and environmental consideration by both the building owner and tenant sides through building lease agreements. At NUD, initiatives include switching lighting in tenants’ exclusive areas to LED with the understanding of the tenants.
As of October 31, 2023
introduced at
10 properties out of 59
■ Introduction of renewable energy
Promoting the introduction of renewable energy to reduce CO₂ emissions.
As of October 31, 2023
introduced at
20 properties out of 59
■ Biodiversity Conservation
Shinagawa Season Terrace has a vast green space of approximately 3.5 hectares, with tree species (Oshima cherry, Quercus serrata, sawtooth oak, Japanese white oak, Japanese dogwood, etc.) arranged in consideration of local characteristics, and the composition of the trees also encourages wild birds to fly over the area. It also has a wetland garden where dragonflies and waterfowl can visit. As a result of these efforts, Shinagawa Season Terrace was certified by Organization for Landscape and Urban Green Infrastructure as a "SEGES Creating Green" greening plan that contributes to society and the environment. It was also certified in 2017 as a "SEGES Urban Oasis" as an excellent and comfortable green space that everyone can use safely and securely, and has been recertified twice, in 2020 and 2023. Furthermore, it received the "Minister of Land, Infrastructure, Transport and Tourism Award" in the urban space category of the 3rd Green Infrastructure Awards (2022).

At Grandpark, approximately 60% of the site is green space, and the plaza in front of the building is planted with a variety of trees. Additionally, the entire area surrounding the building is lush with greenery. It was certified as a "SEGES Urban Oasis" in 2013 and has received recertification three times.
